

What Makes CarbonSpace Data Different?
By Lior Torenberg
March 25th, 2024
We are in the midst of a climate emergency, this much is certain, and a clear path forward is required to help us avoid the worst outcomes of climate change. But we can’t go forward without understanding where we are today: carbon monitoring, reporting, and verification (MRV) is a crucial tool to enable businesses to quantify their carbon footprint so they can set reasonable targets for their supply chain and pursue Net Zero goals.
Agriculture and food systems account for over 16.5 billion tons of greenhouse gas emissions per year, and organizations who work within these systems have an outsized responsibility to operate responsibly; once they know their carbon footprint, they can make plans to reduce and offset emissions through effective and verifiable methods.
But not all carbon MRV solutions are created equally, and the data they use to inform their calculations can vary in accuracy depending on the methodology used.
CarbonSpace’s unique approach to measuring land use carbon emissions emphasizes precision, cost-effectiveness and impact. Read on to learn what makes CarbonSpace’s data different and how it can benefit your organization’s sustainability goals.
How are carbon measurements traditionally done?
Before we delve into CarbonSpace’s unique methodology, let’s cover how carbon measurements are traditionally done. The two primary methods for measuring land use carbon are:
- Physical sampling - the collection of a relatively small set of in situ physical measurements of certain quantities, such as soil organic carbon or canopy height, which are then used either directly or as input to empirical models that provide estimates of emissions or carbon pools
- Averages, proxies, and calculators - the use of assumptions from academic literature to calculate approximate emissions based on the characteristics of a given farm or land plot
Physical Sampling
Soil Organic Carbon
Soil is made up of various minerals and organic components, not all of which represent carbon. There are various chemical processes that can be used to measure how much carbon is in soil. These processes involve meticulous weighing and assessing, sometimes using acid treatment, combustion, or drying soil in an oven to remove these additional components and measure the carbon left behind.
Measuring the carbon present in soil is a careful process, and the resulting accuracy depends not just on how well it is conducted but also on where, when, and how the soil sample was taken — not to mention all the other environmental factors that could vary between sampling periods.
If you took a soil sample now and wanted to compare it to a soil sample in five years, you would want to control for as many variables as possible to ensure you were comparing apples to apples. This is easier said than done, especially considering that soil organic carbon can vary up to 25% across a given field.
Organizations that measure soil organic carbon have to build in more carbon buffers around their estimates, allowing them to claim fewer reductions or credits.
Soil sampling is an error-prone and expensive process for measuring carbon. It requires intensive on-the-ground work across all of your farms at regular intervals. And at the end of this process, you may not be able to claim a commensurate benefit from all of your sustainability efforts.
Tree Allometry
Put simply, tree allometry is the practice of using key characteristics of trees (like diameter, height, and crown dimensions) to infer other properties that may be more difficult to assess (like tree biomass and carbon stock).
A statistical relationship is established between a tree’s characteristics and these other properties based on sampled data. This relationship is then used to estimate the desired quantities in unsampled regions. In general, this approach works best over larger geographical regions, where averaging over large numbers of trees reduces total error. But the more granular you want to get, the more errors in the model will start to impact your results.
There are many allometric equations — both species specific and general — that will each provide different results. To know which equation is most accurate in a given circumstance, those results have to be cross-checked against ground truth by cutting down the trees in a given plot, measuring their biomass, and comparing this to the output of each potential allometric equation.
This is an expensive process with a lot of baked-in assumptions; how do you know that the trees you cut down and sampled are representative of your larger region? How do you maintain confidence in your data without doing additional destructive sampling at regular intervals?
And even the best allometric equations can only account for aboveground biomass. Belowground biomass requires the introduction of additional models that come with their own significant errors.
Allometric equations will continue to improve over the years, and in the meantime, their cons can be best mitigated by using multiple approaches at once. Combining allometric equations with remote sensing can bypass the need for expensive in situ measurements. Carbon flux measurements can bypass model selection errors and the lack of time resolution inherent to tree allometry today, while also providing information that encompasses contributions from multiple carbon pools.
Averages, Proxies, and Calculators
Some organizations choose to take a hands-off approach to carbon measurements by using industry averages, proxies, and/or calculators. This involves using estimates provided by scientific literature and generalizing them to your farms based on similar criteria, like land use type.
The emissions from someone else’s cocoa farm should be similar to yours, right?
Maybe. There are so many variables present on a farm that averages and proxies can only get you so far. What you gain in cost savings and ease-of-use, you may lose in accuracy. Buffers will need to be put in place to account for ambiguity in how much carbon each of your farms is actually emitting or sequestering.
You can achieve a ballpark estimate using proxies, but you won’t know your operation’s exact carbon footprint, and as you stack error margins one on top of the other across your farms, the final figure gets less and less accurate.
If your carbon accounting uncertainty level is high, you won’t be able to benefit as much from your carbon reduction activities.
This means that averages and proxies may end up offering the most benefit to those who do the least work on sustainability, allowing them to claim optimistic averages in lieu of true numbers. But for those that go above and beyond to improve their carbon footprint, using someone else’s average can only bring you down.
How CarbonSpace uses machine learning to transform carbon measurements
CarbonSpace is part of a new wave of digital carbon measurement, reporting, and verification (dMRV) technologies that leverages novel methods to get you the information you need to accurately measure and report on your carbon footprint.
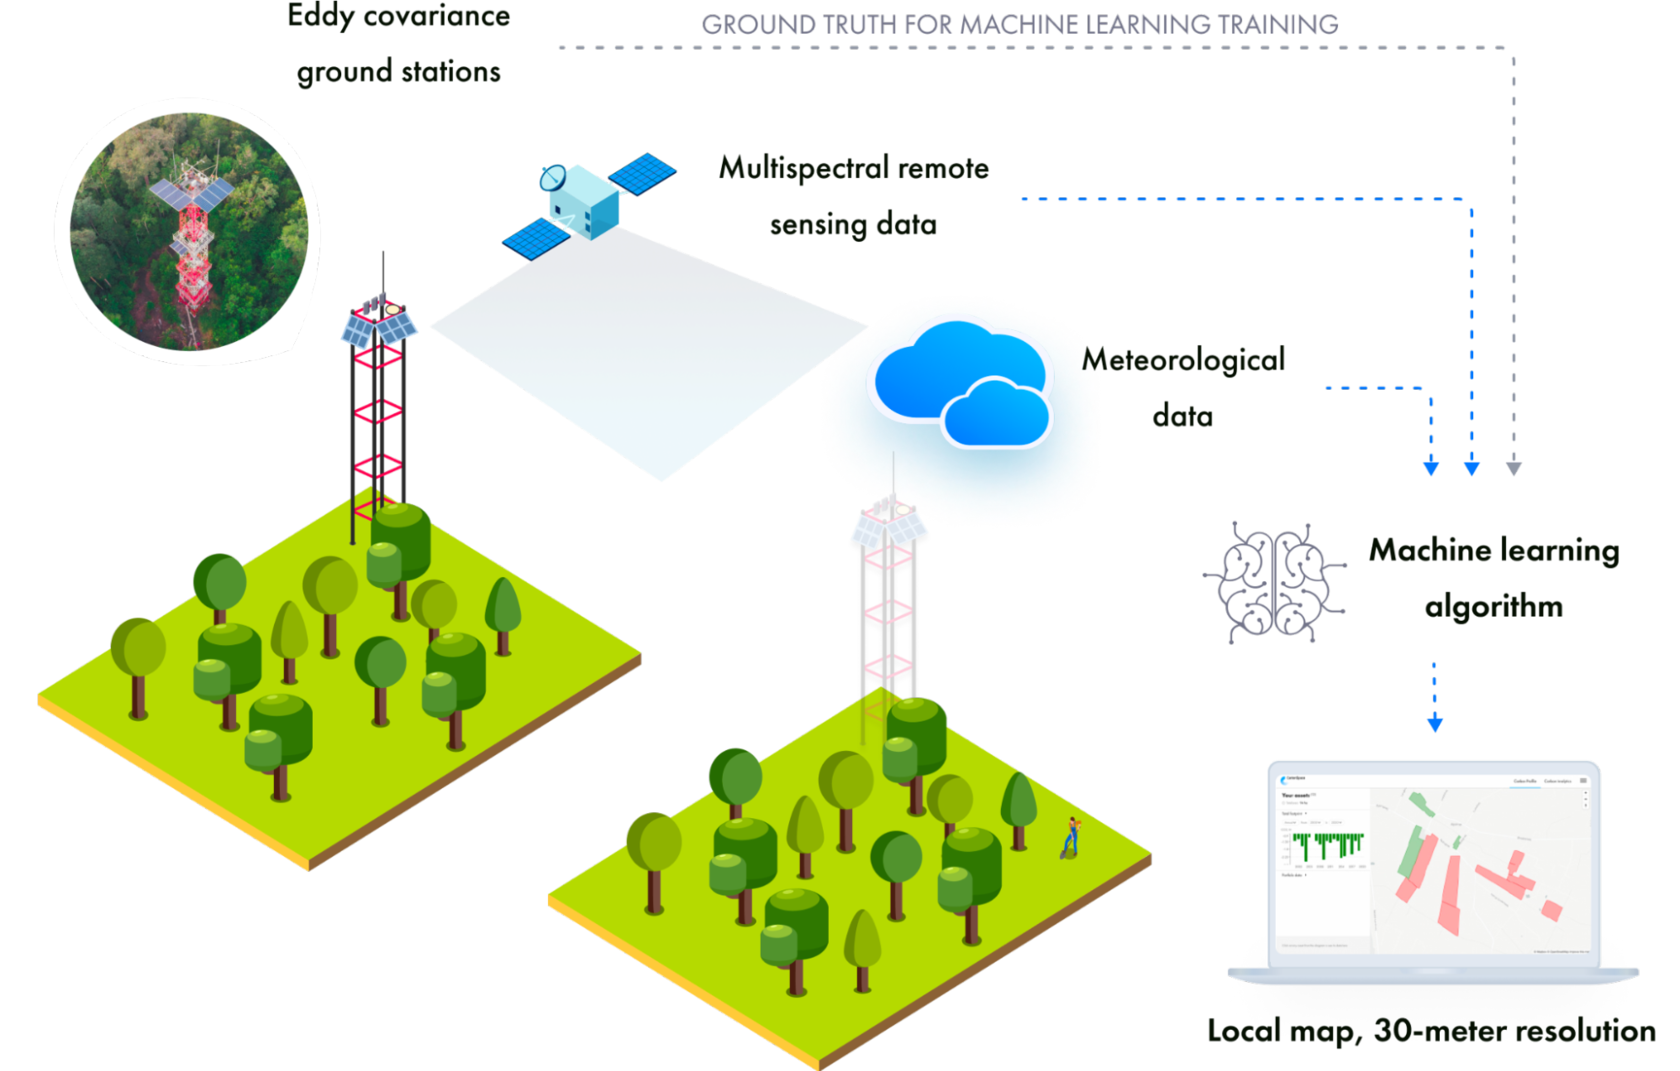
CarbonSpace uses a mix of carbon flux towers and satellite observation to derive its outputs. We’ll cover these two technologies in more depth in upcoming sections, but for now we can think of them as different sources of data that can be analyzed by machine learning to come to a more trustworthy result.
CarbonSpace uses machine learning to process satellite, ground sensor, meteorological, and inventory data to bring industry-leading accuracy to your carbon measurements, so you can account for all of your sustainability efforts and claim the most carbon possible.
Read our foundational peer-reviewed article here: Globally Scalable Approach to Estimate Net Ecosystem Exchange Based on Remote Sensing, Meteorological Data, and Direct Measurements of Eddy Covariance Sites.
The best part is that machine learning-based technology gets better with time; as CarbonSpace’s models are trained on your unique farms and data sets, and as data sources mature, results increase in precision and value.
How Can Satellites Measure Carbon Emissions?
Satellites can make both direct and indirect measurements of carbon by observing changes in different wavelengths of light from Earth.
Direct measurements assess the atmospheric carbon in the column of air between the satellite and the ground, but don’t provide critical information about emissions at the Earth’s surface. Indirect measurements, on the other hand, can provide information about surface-level processes.
Different materials and vegetation reflect and emit light differently according to their state, and machine learning can use this information to draw conclusions about local carbon processes.
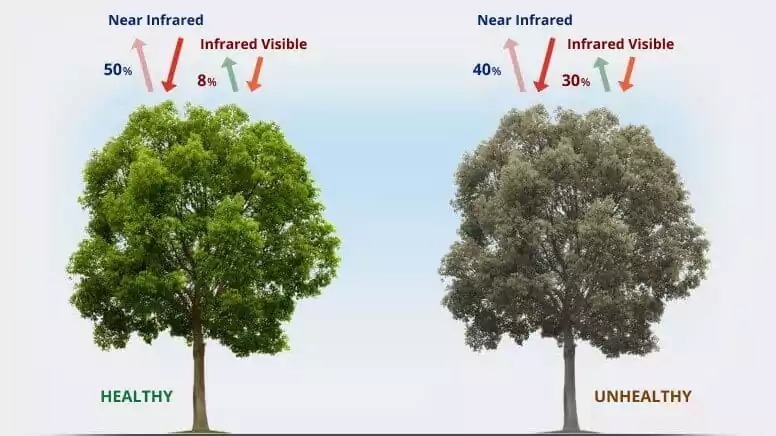
Multispectral and hyperspectral imaging, LIDAR, and SAR are all remote sensing instrument types capable of indirect measurement of carbon emissions. This data is used in tandem with the carbon flux data covered below to come to a final emissions measurement.
Read more about how Earth observation from satellites can help you measure your land use carbon emissions: Satellites’ role in tracking the carbon footprint of land use.
What is Carbon Flux, and Why Does it Matter?
While remote sensing and satellite observation may be familiar ideas, the term “carbon flux” is still new to many people. “Flux” in this context refers to the flow of carbon between carbon sources (emissions) and carbon sinks (sequestration). Flux is the movement of carbon, and flux stations measure that movement to give you a clear picture of your net carbon, taking into account the way your farm’s ecosystem is both emitting and sequestering carbon at the same exact time.
Flux stations aren’t new, but their data has only recently been applied to measuring land use carbon footprints. Flux stations have been around for about forty years, and during this time, they’ve made continuous, direct measurements of the flux of not just carbon but also water vapor, heat, and more. They are some of the most direct tools we have for measuring the exchange of carbon dioxide and other chemicals between the atmosphere and the local ecosystem.
They provide not just direct measurements, but historical data as well. Because they’ve been around for decades, you can use data from a flux station to understand what your farm’s carbon footprint was twenty years ago, or whenever you want to draw a baseline. There are thousands of flux stations around the world covering most land use types, with more to be built in the years to come.
CarbonSpace trains its models on both remote sensing data and flux station measurements to provide a high-fidelity picture of a given farm’s carbon footprint. This novel method is cost-effective and automated, so you don’t have to settle for less when it comes to your sustainable practices.
Read more about flux stations: Flux stations are a critical measurement tool in the agrifood industry’s quest to reach climate goals.
What Makes CarbonSpace Data Different?
While sampling ground soil or relying on proxies and averages is acceptable today, tomorrow’s regulations and guidelines are likely to require much more rigorous measurements. CarbonSpace’s approach allows you to get the breadth and depth of information you need about your farms without compromising on cost or accuracy.
CarbonSpace’s data is unique and combines a diverse set of innovative technologies. Imagery and radar satellites, carbon flux stations, real-time meteorological data, and machine learning are all combined to provide a complete picture of your operation’s carbon footprint at scale, including above- and below-ground carbon pools. This data can support your baseline generation, target setting, compliance goals, LCA and emission factors updates, and more.
What Makes CarbonSpace Data Different?
Rigorous measurement can help you avoid inadvertent greenwashing and account for the highest amount of carbon possible in your claims, lowering the need for built-in buffers. Data is also auditable and verifiable so you can report with confidence.
Because CarbonSpace’s data can be measured remotely, you can better manage your supply chain with a bird’s eye view of how all of your suppliers are performing. You can assess and rank farmers, assess new suppliers, conduct preferential sourcing, and have confidence in your sustainability premiums and claims.
Most importantly, you can move forward with sustainability, accessibility, and transparency top-of-mind. Scientific rigor and research cooperation lie at the heart of CarbonSpace’s approach, and we are committed to being fastidious about our data so you can do the worthy work of rebuilding a better, more sustainable environment for us all.
Get in touch to learn more about how CarbonSpace can support your emissions monitoring, reporting, and verification goals.