

Satellites’ role in tracking the carbon footprint of land use
What exactly is the role of satellites in monitoring CO2 emissions and sequestration from land-use? And how do these satellites work?
By: Lydia Ashburn
July 31, 2023
July 31, 2023
Conversations about tracking greenhouse gas emissions (GHGs) and climate change mitigation often include satellites, especially in the land-use sector.
As food & beverage companies work towards their net zero goals, they need reliable tools to measure the baseline emissions of their agriculture supply chains and the ongoing impact of new practices intended to reduce GHG emissions and sequester CO2.
These tools must be scalable, cost-effective, and able to reach remote areas of the world. This is where satellites come in. But they’re just one part of a reliable approach to land-based carbon footprint accounting.
In this blog, we’ll walk through the various types of satellites that contribute to GHG tracking and discuss how satellites are just one of the tools necessary to accurately monitor CO2 sinks and sources in the land.
How can satellites actually measure greenhouse gasses?
The satellites that help us measure GHGs can be broken into two categories: those that make indirect measurements and those that make direct measurements.
Indirect Measurements
There’s a host of satellites using various methods to record characteristics of the earth’s surface. This data is correlated with other scientific measurements to model GHG flows.
Multispectral imaging satellites detect visible light and infrared wavelengths reflected from the Earth’s surface. These satellites use the distinct reflective properties of various materials, enabling the tracking of vegetation, among other applications.
One powerful tool derived from this imagery is the normalized difference vegetation index (NDVI), which is a measure of plant density and health based on the relationship between detected wavelengths.1 For years, NDVI has been widely used in agriculture for critical activities such as early identification of crop disease or drought.2
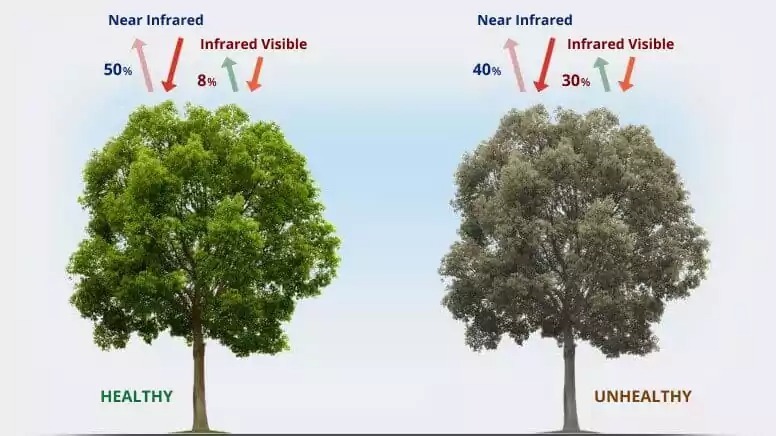
Visual representation of the normalized difference vegetation index (NDVI) 3
Sentinel-2,3, Landsat-5,7,8,9, and Terra/Aqua are some of the missions collecting multispectral imagery.
Hyperspectral imaging satellites capture even more wavelengths than multispectral imagery, providing more information about chemical and biological processes. EnMap is an example of a hyperspectral satellite mission tracking the status of earth’s ecosystems.
Active instruments such as LIDAR (light detection and ranging) and SAR (synthetic-aperture radar) project laser light and radar waves, respectively, onto the Earth’s surface. Reflections from the projected waves can be used to reconstruct solid surface features, vegetation structure, and other characteristics of interest.
GEDI, mounted on the International Space Station, is an example of a LIDAR instrument that provides “answers to how deforestation has contributed to atmospheric CO2 concentrations, how much carbon forests will absorb in the future, and how habitat degradation will affect global biodiversity.”
Direct GHG Measurements
The second category is satellites that make direct measurements of atmospheric GHG concentrations in the column between the satellite and the earth’s surface. GHG molecules interact with light, so satellites detect GHGs by picking up on what wavelengths of light are reflected and absorbed and to what extent.
GOSAT, Sentinel-5P, and OCO-2 are examples of satellites that collect GHG concentration data.
(Fun fact - our Head of Science, Robert Granat, played a key role in the development of scientific algorithms and software for NASA's OCO-2 satellite.)
Which satellites are used for carbon footprint monitoring for land-use?
While directly measuring atmospheric GHG concentrations may seem sufficient for carbon footprint monitoring, it’s not so straightforward.
Atmospheric GHG concentrations include emissions from both the land and human activity, and even events such as fires or volcanic activity. This emissions data is helpful for visualizations of GHGs on a large scale. See examples from NASA here.
However, GHG concentration data is not as useful for honing in on specific plots of land at the farm, field, or forest level to understand the carbon sequestration impact of land management practices.
Plants absorb and release CO2 through photosynthesis and respiration, so we need to understand the net result of these processes (i.e. net ecosystem exchange) to determine if an area serves as a carbon sink or source over a specific period of time.
Satellite imagery, along with other scientific data, enables us to achieve this modeling.
How does CarbonSpace use satellites to provide carbon footprint data for the agrifood industry?
We’ve developed machine learning algorithms trained on multispectral satellite images and vegetation indices, meteorological parameters, and CO2 flux data from a network of ground flux stations, which make direct CO2 flux measurements using the eddy covariance method.
As a result, we’ve created models to accurately estimate net ecosystem exchange in each of the earth’s major land cover types, for any area 1 hectare (2.5 acres) or larger.
Monitoring the land’s role as a net sink or source of CO2 is critical for food & beverage companies evaluating their agrifood supply chains and nature-based solutions in pursuit of reaching net-zero goals. And the combination of satellite imagery with flux station data is a groundbreaking approach that makes this possible.
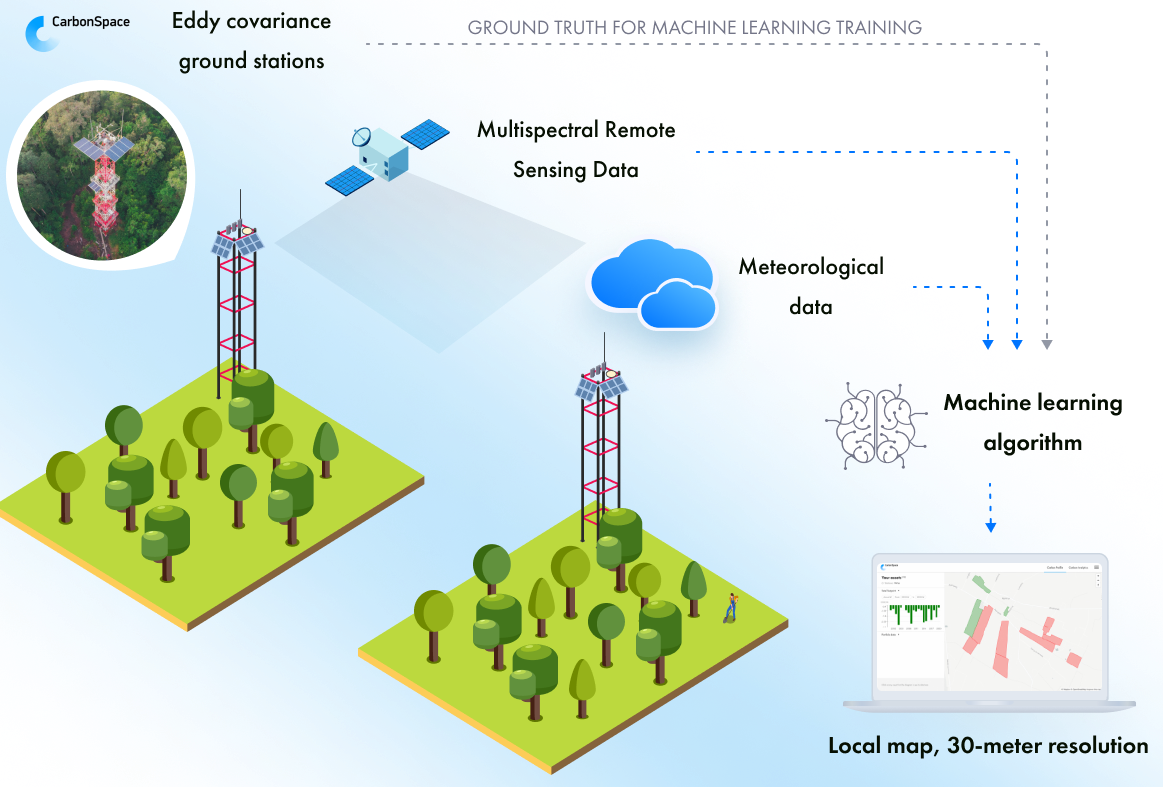
CarbonSpace technology infographic, demonstrating combination of satellite imagery, ground flux stations, meteorological data, and resulting ML algorithms
How does the CarbonSpace approach differ from other satellite-based carbon footprint monitoring approaches?
Many other satellite-based data providers use satellite imagery to verify, on a yes/no principle, whether a specific practice was implemented or to detect disturbances such as land-use change or deforestation. But they still turn to averages or proxies, such as aboveground biomass, to calculate the event’s impact on carbon sequestration or emissions.
Our solution correlates satellite imagery with continuous, direct measurements of GHG fluxes made by a global network of ground stations and meteorological data. This combination of data layers is critical for accuracy.
We don’t use any averages or proxies, so our data is primary and specific to the supply chain or project being monitored. Primary data is key for credible climate action and impact.
How can the agrifood industry benefit from satellite-based carbon footprint tracking?
Due to their scalability, satellites provide a critical basis for the supply chain monitoring food & beverage companies need to reach their land-based climate goals. But satellites are only one piece of a thorough approach.
By combining satellite imagery with ground station measurements, we bring reliable, primary data to the agrifood sector so that measurement is no longer the roadblock to supply chain decarbonization efforts.
Let’s talk about the benefits of primary data for your agrifood supply chain and nature-based carbon removal projects: info@carbonspace.tech
Acknowledgements
Thank you to our Head of R&D, Dr. Andrey Dara, and our Head of Science, Dr. Robert Granat, for their valuable guidance and contributions to this blog.
Thank you to our Head of R&D, Dr. Andrey Dara, and our Head of Science, Dr. Robert Granat, for their valuable guidance and contributions to this blog.
References
Social media thumbnail source here.
- Landsat normalized difference vegetation index. Landsat Normalized Difference Vegetation Index | U.S. Geological Survey. (n.d.). https://www.usgs.gov/landsat-missions/landsat-normalized-difference-vegetation-index
- NASA. (n.d.). Measuring vegetation (NDVI & EVI). NASA. https://earthobservatory.nasa.gov/features/MeasuringVegetation/measuring_vegetation_3.php
- NDVI mapping in agriculture, index formula, and uses. EOS Data Analytics. (2023, June 12). https://eos.com/make-an-analysis/ndvi/
Social media thumbnail source here.